2019 Report
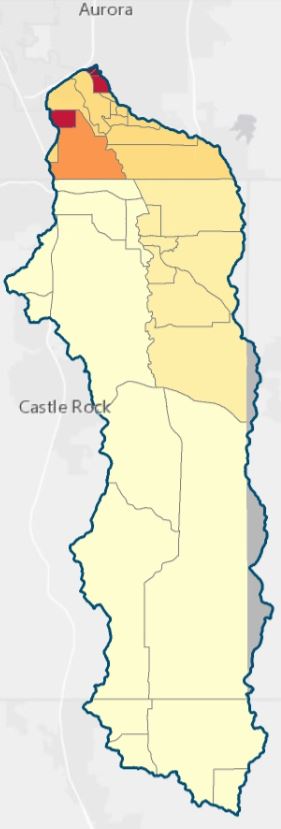
Population Growth

-
29 - 100
-
101 - 200
-
201 - 400
-
401 - 800
-
801 - 1600
-
1601 - 3200
-
3201 - 6975
Population per square mile
Population in the basin has grown significantly. The 2015 population in the basin was 6 times higher than it was in 1980. Population increases generally impact water quality with increased runoff and point and nonpoint source pollutants. However, through strong partnerships with local, state, and federal stakeholders, CCBWQA has worked to moderate nutrient productivity in the reservoir.
Hey! This page is interactive.
Hover over a point on the graph to see the population number and map for the year
