CCR Nutrient Balance
Highlights:
In WY 2022, phosphorus and nitrogen in the Reservoir increased by approximately 3,100 and 32,000 pounds, respectively, approximately 60% and 95% of the respective historical averages.
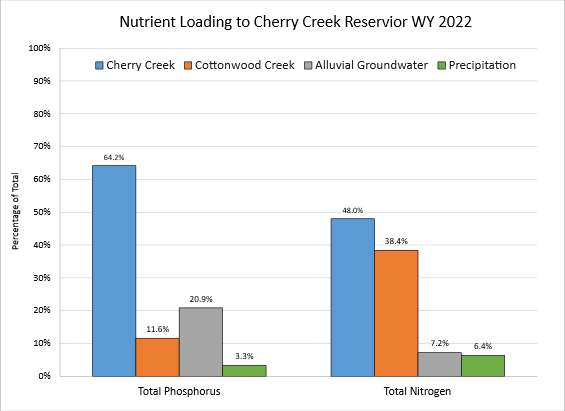
The differences in flow and nutrient concentrations between Cherry Creek and Cottonwood Creek are apparent when evaluating the relative nutrient loading from each source. Cherry Creek contributed 64% of the phosphorus and 48% of the nitrogen loading to the Reservoir in WY 2022. In comparison, Cottonwood Creek was responsible for less than 12% of the phosphorus but 38% of the nitrogen.
The nutrient concentrations of all inflows and the outflow of Cherry Creek Reservoir are used to calculate the mass storage on an annual basis. Phosphorus and nitrogen loading to the Reservoir results from surface water from Cherry and Cottonwood Creeks, precipitation and alluvial groundwater. The concentrations of each source are multiplied by their relative inflow to determine loading.
Relative Percentage of Inflows into Cherry Creek Reservoir WY 2022
| Source |
Total Phosphorus |
Total Nitrogen | % of Total Inflow |
|---|---|---|---|
| Cherry Creek | 217 ug/L | 1,680 ug/L | 50% |
| Cottonwood Creek | 66 ug/L | 2,245 ug/L | 30% |
| Alluvial Groundwater | 254 ug/L | 909 ug/L | 14% |
| Precipitation | 100 ug/L | 1,978 ug/L | 6% |
| Weighted Total | 170 ug/L | 1,756 ug/L | 100% |
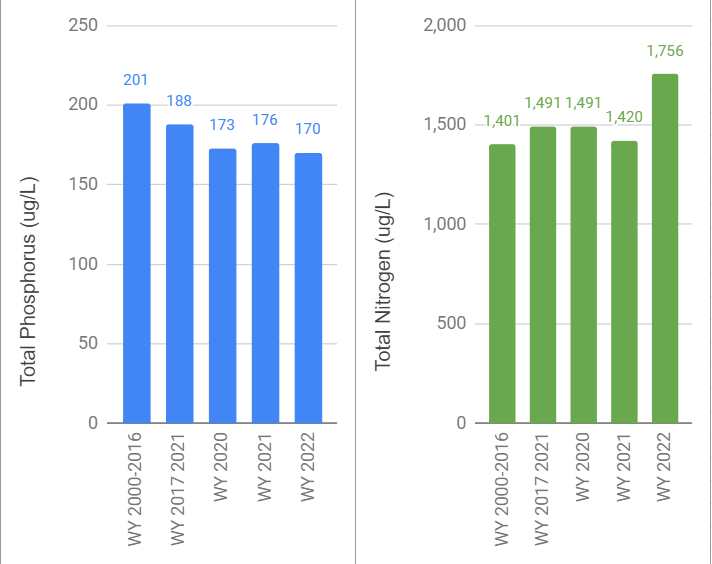
The flow-weighted influent phosphorus goal, derived as part of the 2009 Regulation 38 rulemaking process to achieve the 18 ug/L chlophyll α standard is 200 µg/L. The WY 2022 flow-weighted TP concentration of 170 ug/L for all inflows is lower than recent years and historical medians. In contrast, the WY 2022 flow-weighted TN inflow concentration of 1,756 ug/L is higher than recent years and historical medians.
Total Flow-Weighted Nutrient Concentrations Over Time

Useful Links

Nutrient Loading

info_outlineCherry Creek contributes the majority of both phosphorus and nitrogen to the Reservoir.
